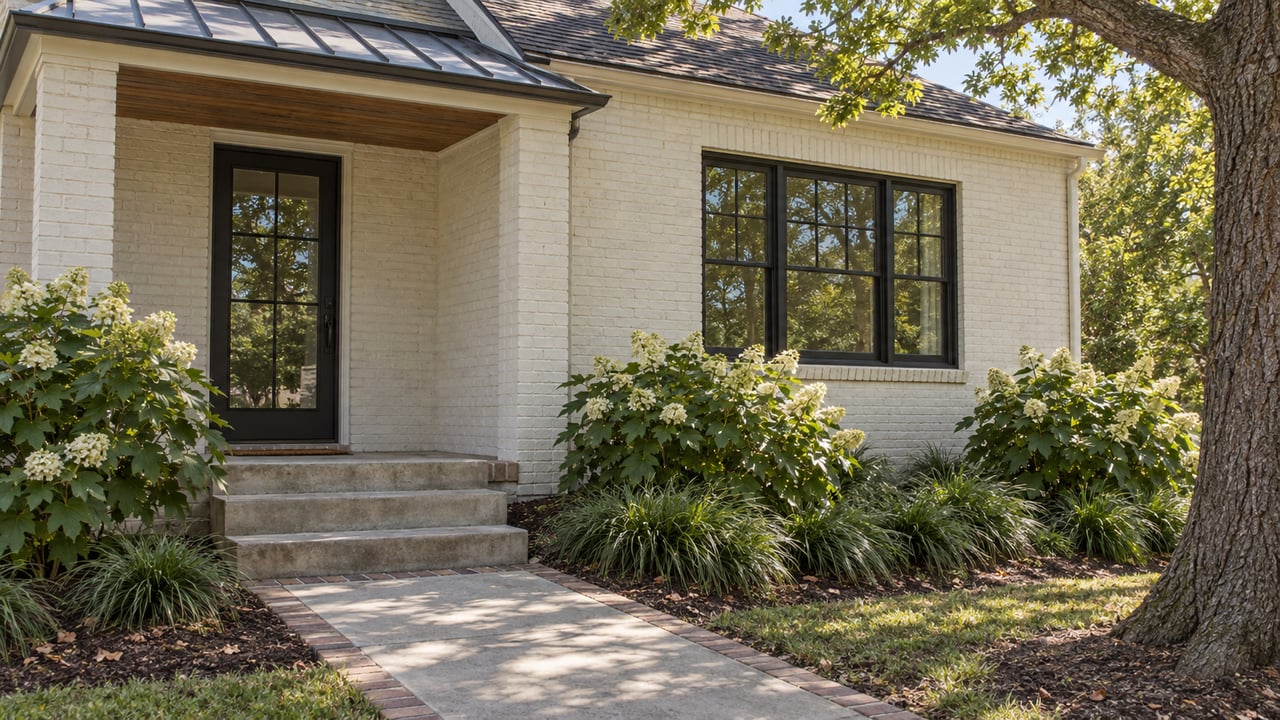
West End's Median Sale Price Rose 94%—Based on Just Six Sales
October 1, 2026
October 1, 2026
A relocating buyer scanning listing sites for Winston-Salem neighborhoods this year would find one number impossible to ignore. In March 2026, West End's median sale price hit $412,000, up 94.1% from the year before, according to Redfin. Ardmore, the city's other flagship historic district, had a comparatively sleepy 5.1% year-over-year gain in February 2026. Read at face value, West End looks like the neighborhood catching fire.
It isn't. Six houses sold in West End that month. Ardmore had 29 sales in February 2026. When a median is built from six data points instead of twenty-nine, one unusual sale doesn't nudge the number. It hijacks it.
Median price is a simple calculation: line up the sale prices, take the middle one. That math works fine when you have hundreds of transactions smoothing out the noise. It breaks down fast when you have six.
West End is a small, dense historic district that began as one of Winston-Salem's first streetcar suburbs in the 1890s, and its housing stock runs the full range from modest bungalows to soaring Queen Anne and Colonial Revival estates with 11-foot ceilings and original moulding. In a typical month, the mix of what happens to close, one restored mansion near Hanes Park versus a smaller starter home a few blocks over, can swing the median by tens of thousands of dollars without any actual shift in what the neighborhood is worth.
Redfin's own numbers hint at this instability from another angle. In that same March 2026 window, West End's median price per square foot fell 47.7% year over year even as the median sale price rose 94.1%. Those two figures moving in opposite directions on the same six sales isn't a contradiction. It's what happens when a bigger, pricier historic home closes in a month where the typical home is smaller. The average size of what sold went up faster than the average price, so price per square foot looked like it collapsed while the headline number looked like it soared.
Other listing sites tracking West End over roughly the same period reported the opposite direction entirely. One showed the trailing 12-month median down 9% from the prior year. Another, pulling a different window, showed it down 28%. Three sources, tracking the same small pool of homes, produced three signals that don't agree on direction, let alone magnitude. That's not a data quality problem you can fix by picking the "right" source. It's the mathematical signature of a market too thin to support a reliable median in the first place.
Ardmore doesn't have this problem, and the reason is scale. It's Winston-Salem's largest historic district, with more than 4,000 properties built primarily between 1910 and 1940 for the bank clerks, factory foremen, and teachers of the city's industrial era. Twenty-nine home sales in a single month is enough transactions for a median to mean something.
What that steadier number says is worth paying attention to. Ardmore's median sale price reached $310,000 in February 2026, up 5.1% year over year, with days on market compressing to 52 from 70 the year before, according to Redfin, which rated the neighborhood 79 out of 100 on its competitiveness scale, "very competitive." Zoom out to the district's longer-run trend and appreciation has been running closer to 10 to 13% annually.
The more telling detail sits in inventory. Across most Winston-Salem submarkets, active listings were rising 13% to 47% year over year heading into spring 2026, part of the broader loosening that's shown up in slower price growth and longer sit times citywide. Ardmore moved the opposite direction, with inventory down 7.7% over the same period. While much of the city was gaining breathing room, Ardmore was tightening. That's a real signal, not a sampling artifact, because it's backed by enough transactions to trust.
| West End (March 2026) | Ardmore (February 2026) | |
|---|---|---|
| Homes sold | 6 | 29 |
| Median sale price | $412,000 | $310,000 |
| Year-over-year change | +94.1% | +5.1% |
| Days on market | 46 | 52 |
The West End column isn't wrong, exactly. It's an accurate description of six transactions. It just can't do the job a median is supposed to do, which is describe a market.
Once you set the percentage swings aside, the two districts are easier to compare on what a buyer's money actually gets.
Ardmore's housing stock runs mostly 1,200 to 2,000 square feet, three bedrooms, Craftsman bungalows on modest lots backing up to alleys. The neighborhood sits between Miller Park, with 37 acres of trails and tennis courts, and downtown, connected by the Strollway greenway. Miller Street has a bakery, a coffee shop, and a vintage store that turns into a bar on Thursday nights. Atrium Health Wake Forest Baptist Medical Center is half a mile from the eastern edge, which is part of why the district draws steady interest from healthcare professionals working nearby.
West End trades bungalow scale for architectural range and a different kind of walkability. Homes here, recognized on the National Register of Historic Places, run from Queen Anne to Neo-Classical Revival to Craftsman, several with the kind of high ceilings and original millwork that don't show up in newer construction anywhere in the city. Grace Court offers a small formal garden with a fountain and gazebo. Hanes Park sits less than a mile from most addresses. West Fourth Street's mix of cafes, bars, and boutiques, including Joyner's, West End Café, and Louie & Honey's Kitchen, is a short walk for most residents, and Truist Stadium is close enough for an easy evening out. Grocery options are covered by a Harris Teeter, a Whole Foods, and a Publix all within a mile and a half.
Neither description depends on which month's median happened to spike. Both hold true regardless of which six or twenty-nine houses closed.
The practical takeaway isn't to avoid West End because its numbers are noisy. It's to ask a different question before trusting any neighborhood-level statistic: how many sales is this built from?
A citywide median drawing on hundreds of monthly transactions can absorb an outlier without much distortion. A small historic district drawing on single digits cannot. Before treating any year-over-year percentage as a signal about where a neighborhood is headed, it's worth asking your agent for the actual transaction count behind it, not just the headline change. A 94% jump on six sales and a 5% gain on twenty-nine sales are not comparable claims, even though a listing site will happily print them side by side as if they were.
This matters most for buyers trying to time an offer around perceived momentum. Chasing a headline percentage in a thin market means chasing whichever house happened to close last, not the neighborhood's actual trajectory.
Is West End actually appreciating, or is the 94% number meaningless? The number itself is accurate for the six sales it covers. It just isn't a reliable read on the district's overall trend, given how few transactions it's built from and how sharply other sources tracking the same neighborhood over similar windows disagree on direction.
How many sales does it take before a neighborhood median becomes trustworthy? There's no fixed threshold, but the gap here is instructive. Ardmore's 29 monthly sales produced a stable, directionally consistent trend across multiple data sources. West End's 6 produced three contradictory readings. More transactions dilute the influence of any single unusual sale.
Should a buyer rule out West End because the data is unreliable? Not at all. The architecture, the walkability to West Fourth Street, and the National Register status are real and don't depend on any given month's median. The data problem is about trusting the percentage, not about the neighborhood's underlying appeal.
If you're weighing West End against Ardmore, or trying to figure out what a specific address is actually worth once you set the portal percentages aside, Pilot Group Real Estate can walk you through the real comps behind either neighborhood's numbers.
Stay up to date on the latest real estate trends.


We provide mentorship, resources, and a collaborative environment where you can grow your real estate career and make a meaningful impact in our community.